On Facebook awhile back, Breanna asked about reading Google Analytics:
I’m sure she’d want me to say she sent that from her phone and it typed it for her. She’s normally a very clear sentence writer. But I totally get what she’s saying. And since I’ve never written about it before I thought this would be a good time to do it.
If you have ever looked at Google Analytics, you know it’s enough to be overwhelming. And while I am writing this from my business point of view (year round, service-oriented business not doing ecommerce) it might give you a few good places to think about (or not think about)
Three Metrics I Care About
These are items I look at when I figure out how I should be spending my time.
Social Overview
As a social media person, I clearly care if what I do is generating traffic to the website… and making people do what I want (like fill out my contact form or meeting schedule form). Under ‘Traffic Sources’, ‘Social’ is now its own section allowing people to tease apart this data for themselves.
Content Overview
As a blogger, I care about what people are (and aren’t) reading on the website.
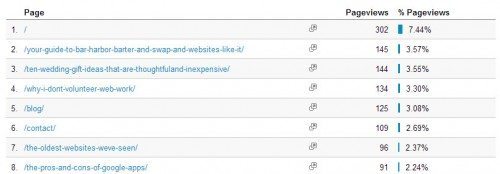
There are certain pages I really want people to get to. For most websites the ‘homepage’ is around 50% of the traffic but for me, while it’s still the top item (homepage is usually indicated by a slash with nothing after it), it is 8% of all visitors from last month. Things I want people to see ‘Why I Don’t Do Volunteer Web Work’ (ie Please don’t ask me for free stuff) and ‘Contact’ (ie Want to think about buying something from Breaking Even). The wedding gift idea blog post I wrote way back in the day? Not so important. So I might check out why that one is up there.
Traffic Sources Overview
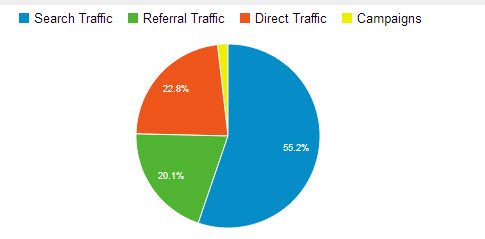
This is actually pretty typical. That’s right, my graph is typical with what I see with other businesses I work with.
There are several ways people can get to websites: search engines, inbound links, and direct traffic. Most people have search engines make up about 50% of the traffic mix. (I am owning Google but I’d really like to be doing better in Yahoo and Bing but that’s another story). Referral traffic means sites linking to this one: links coming in from social networks, other blogs, etc. And direct traffic is someone typing in or clicking on my site directly. In my case right now there is a small paid Google Ad getting people to my site (the yellow strip). As I always say, paid ads should never be more than 10% of a budget and in my case, they clearly aren’t.
It really makes me uncomfortable to put all my eggs in one basket. In this case if my search rank tanks or Facebook stops referring so much traffic, I still have other sources getting people to the site. I like this pie chart to look balanced, for me and my clients.
Other stuff I might care about:
- Any links I’m paying for. If I am paying to be listed on a website it better be driving traffic and conversions for me.
- New visitors- I always want new visitors of some sort.
- Exit pages- If I have some page that has a ridiculously high exit rate, what is on that page is scaring people away?
Three Metrics I Don’t Care About
I might look at these metrics quarterly or observe them as an ‘isn’t that interesting’ observation.
Location
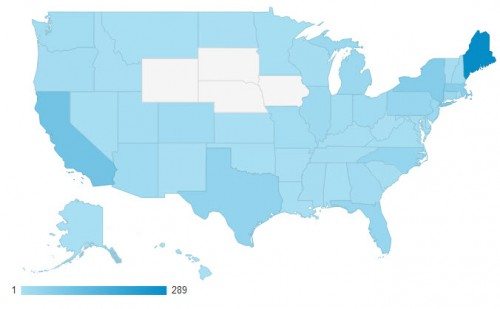
I don’t sell local products, I don’t have a storefront, and my customers could be anywhere. While I am flattered that most of them are in my home state of Maine, it wouldn’t break my heart if they weren’t. (The California visitors are definitely intriguing to me… say hi you guys!)
Bounce Rate
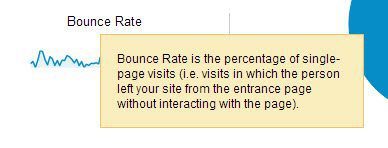
While I want people to stay on the site as long as possible, them not getting beyond one page is not a big deal to me. Maybe they were looking for my phone number or Pinterest link and it was on that page already. Whether it takes someone 30 seconds or 3 minutes to find what they need, I want my visitors to find it.
My bounce rate is pretty low (7%) but I’ve had people panicking at 60%. Now if I sold online products, I might care about a high bounce rate but if I was, say, a real estate agent with my phone number in my website header and I was getting lots of calls everyday, the high bounce rate wouldn’t phase me.
Mobile
About a year ago, mobile users were around 10% of visitors when we redid our website with a responsive template. Now mobile visitors are around 15% plus ‘tablet’ is now its own category around 10%.
Did they increase because our site was improved for mobile users (more about responsive design here) or because mobile visitors would have increased anyway even if we did nothing? Hard to say. Kind of a chicken/egg situation.
Am I saying I don’t care about mobile users? No I’m not. But I do know my site is addressing them… and I don’t need to keep looking at this to know their numbers are going to keep going up.
Note: If you don’t have a mobile website, you should use these stats to show your boss/board that this needs to change!
Now clearly these items you care about are going to be different for different people. (Ex: If you have a cart, you are going to care about the visitor flow way more than I do.) But the point is, you can’t do it all. Caring about everything will make you crazy and cause you to spend 10 hours of every month generating reports that your boss won’t read.
So pick a few metrics you are going to track and stay on top of them… and know that it’s ok to not care about some things. I certainly pick my battles!
Want to learn more? Here’s 50 resources for getting the most out of Google Analytics, good for users at all stages. Or let Google take you through learning to analyze your Google Analytics. Or contact us and we’ll tell you what we’d care about if it was us. Either way, no need to be scared off by charts and graphs… you can totally do this. So make friends with your Google Analytics… just don’t hang on their every word.


